
Written in collaboration with Eddie Blake.

This essay was published as part of “Dixit Algorizmi – The Garden of Knowledge” the catalog of the Pavilion of the Republic of Uzbekistan at The Venice Biennale 2022. Dixit Algorizmi – The Garden of Knowledge is an ongoing exhibition and research project curated by Space Caviar and Sheida Ghomashchi, reflecting on the history of technology and its relationship with contemporary artistic production.
The full book is for sale here: https://www.humboldtbooks.com/en/book/dixit-algorizmi
—
Today, the map lies scattered across billions of data points—infinite subjective views on digital screens, all updating in real- time. Far from being a unifying, stabilising phenomenon as it once was, the map is now fractured. How did we get here, and what does this mean for our worldview?
Arguably, the trajectory that has led us to Uber and Google Maps started when al-Khwārizmī compiled Kitāb Sūrat al-Ard (The Book of the Description of the Earth), a book that encapsulated the whole known world into a single edition. Distilling something as complex as the world into a single book was, and still is, a dramatic feat of imaginative abstraction. In that process, the world had been reformed — the territory transposed onto the map. In this essay, we discuss what is so important about the map, how it has evolved, and the unnerving idea that whoever makes the map, also makes us.
The Book and al-Khwārizmī’s wider output were highly influential for generations of map-makers. In c. 830, he was a key figure in the production of the pioneering world map commissioned by caliph al-Ma’mūn. In the 11th century cartographical collection, The Book of Curiosities,1 several maps appear to be largely based on al-Khwārizmī’s data tables. Similarly, al-Khwārizmī’s influential Zij — or collected volume of astronomical data — would also prove influential, being republished centuries after al-Khwārizmī’s death in the Toledan Tables, a key source for medieval astronomy.2 What made al-Khwārizmī’s map-making influential wasn’t the visual representations, or even the visible graphics at all, but the way he calculated data and articulated new mathematical tools.3 His contribution was the unseen infrastructure, the dark matter of coding, which underpins a map’s visual representation.
Al-Khwārizmī’s expansion of spherical trigonometric techniques, in turn, enlarged the measurable world as foundational tools in mapping and projection for a millennium. Perhaps the foremost practical aspiration of his time was to find accurate calculations of Qibla:4 the direction of Mecca. But the underlying logic of this practical applica- tion from the Middle Ages also lays the groundwork for the contemporary mathematical operations which underpin data processing within Geographic Information Systems (GIS) and more broadly across Geodesy.
Fluency with algebraic calculation, knowledge of gnomonics (the design of sundials), astronomy, and the astrolabe (the design of mechanical models of the universe) is what enabled al-Khwārizmī to compile such accurate data. Taken together, we may consider his prodigious output of mathematical knowledge an embryonic foray into the production of big data — from abstract foundational trigonometric values to astronomical data and cartographic locations. Such data would ultimately become the basis of how the world is ordered. In al-Khwārizmī’s work, we can see an early expression of the now commonplace powerful rela- tionship between reality, abstraction, and data.
While superficially neutral surveys of ground truth, maps are of course anything but ideologically passive. Architects and urban planners instinctively separate the idea of the map from the most fundamental tool in their work, the plan, but it may be more instructive to consider them as connected cousins. Understanding the differences between the map and the plan is not immediately obvious. In fact, they can be superficially indistinguishable. Both represent less than what is actually there, by distilling information and setting up a hierarchy of what is important or not. There is a difference of intent also: plans arepropositional, maps are descriptive. The map is a space in which we share the location of discovered objects. The plan reveals the order of things that have been or will be arranged.
Historically, map-makers refined the boundaries between what was known and what wasn’t. What existed outside — terra incognita — constituted a call to discovery and imagination. As far-flung cities entered geography, they became elements of military strategies and trade networks. All places were once uncharted space. The map makes room for the plan.
A map is a series of symbolic gestures, a series of tricks and abstractions; scale, symbols, keys, orientation, all work to quickly communicate something unfathomably complex. These tricks work through a kind of map infrastructure, made up of projections, grids, and tabulated data. Yet, in the age of screens, we have another conceptual leap to make: resolution. It is the measure of an image, which quantifies how much information exists in a space. It is an estranged cousin of scale. When we can zoom and scroll, suddenly resolution becomes the key quality that allows us to see through the layers of representation and glimpse the data beneath. The higher the resolution, the closer to reality we get. But even at the highest resolution, the map doesn’t become the territory.
Comparing ‘the map’ and ‘the territory’ is a philosophical issue as old as mapping itself. It is possible to forget that the elementary difference between the two is that ‘maps’ exist by virtue of a trick — by mathematical projection — abstracting the near-spherical earth into a two-dimensional geometry. This process is an example of the human capacity to abstract, simplify, and approximate. So, when we ask “who makes the map” we are also asking what kind of abstraction is taking place. Grids, coordinate systems, and projections do not physically exist out there in hard reality. They occur in the conceptual space of possi- bilities in which geographic knowledge exists.
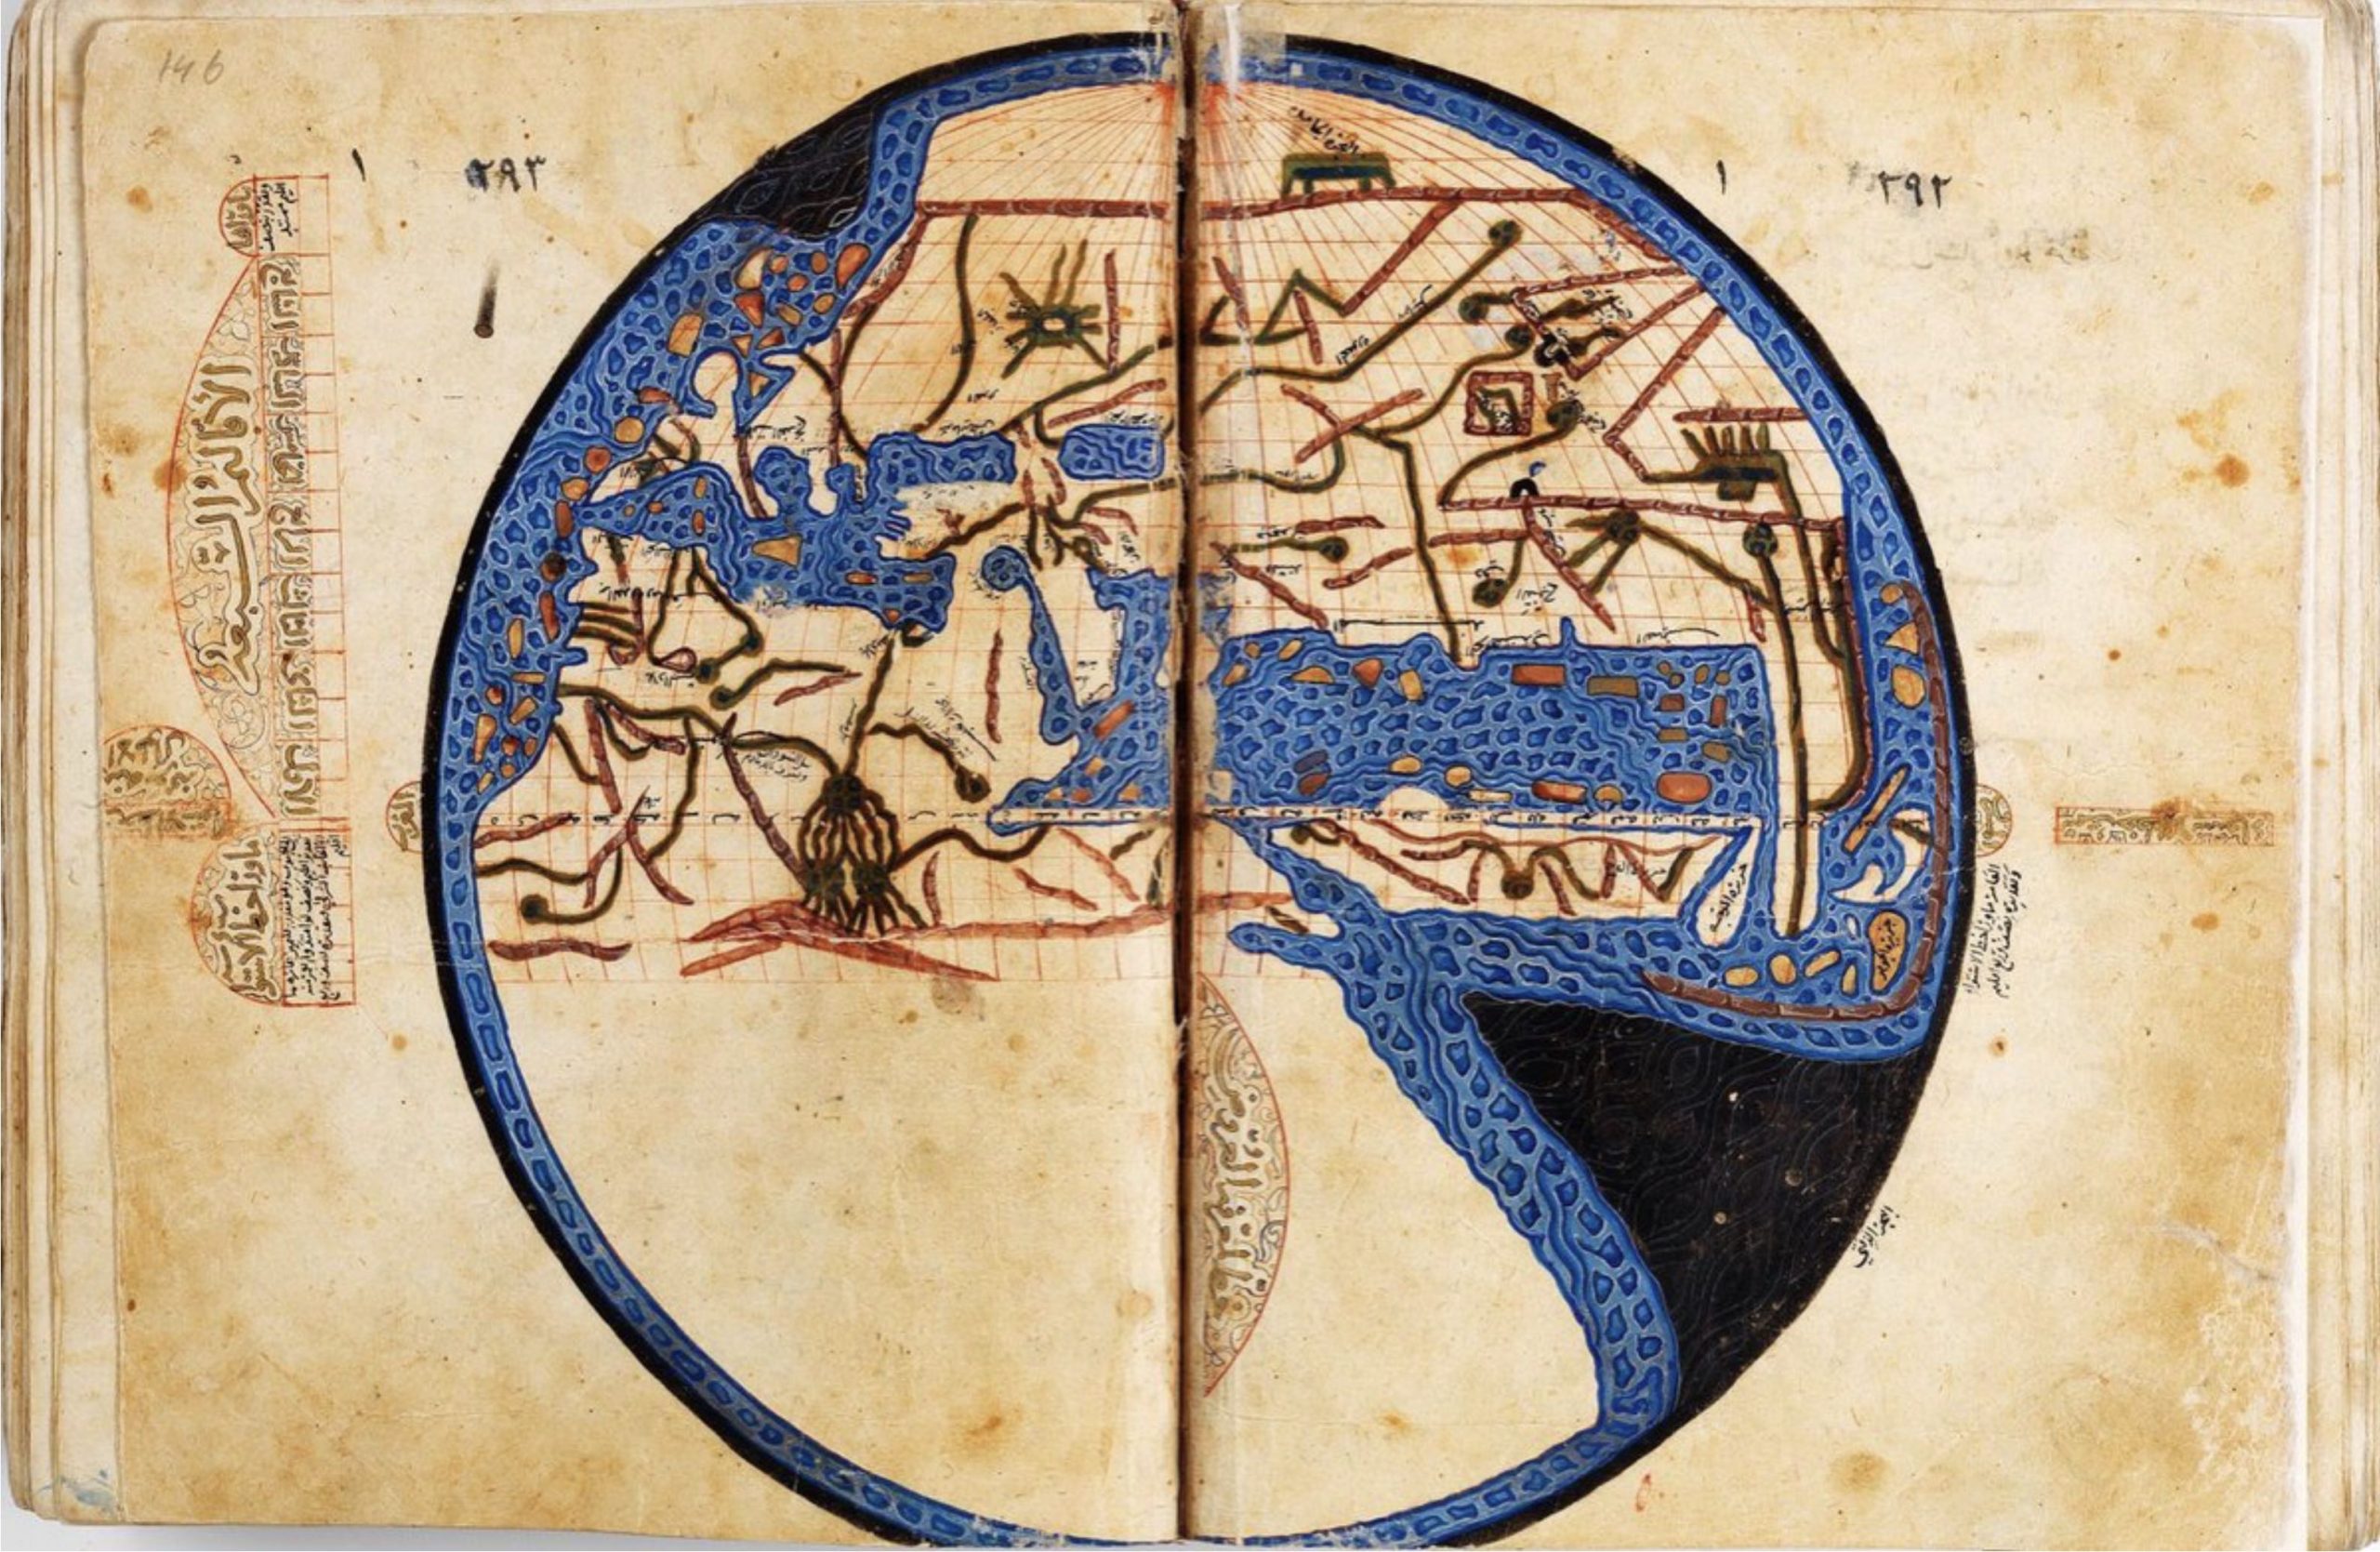
In Islamic medieval maps, the earth is most commonly shown as a circle, sometimes an oval, only occasionally a rectangle.5 The circle usually showed the poles reversed with the South at the top and represented a simplified projection of the single hemisphere that was believed to be inhabited. In this graphic construction, we can see what the map-makers’ contemporaries believed the world to be like, and perhaps what they wished the world to be like.
The Shape of The Earth
In The Book of the Description of the Earth, al-Khwārizmī expands directly from Ptolemy’s contributions to cartography and the original invention of the science of geography. The Geography of Ptolemy (and, in turn, al-Khwārizmī) locates objects and places in relation to the whole, across the unfolded surface of the planet, rather than with each other. Ptolemy also proposed several map projections, the most complete attempt to systematise the coordinates through which places might be located.6
Geography, in its classical form, was the study of where things are relative to the greater planetary whole, rather than each other. For al-Khwārizmī, his map data could represent something akin to an objective grounded truth about the world, which could be continually refined and made more accurate. Any map, however, encodes a world view — co-locating the viewer and the observed — guiding the reader through a territory and, therefore, inscribing it. In turn, the map reshapes the represented territory.
A feature of our contemporary world so comprehensively mapped is that there is no outside to the geographic boundary of knowledge. Instead, the focus of analysis is on charting all things and their interactions, all the time. The binary between mapped and unknown gives way to refresh rates and image analysis artefacts. When did we last scan how reliable is the algorithm? The 16-inch pixels of the GeoEye-1 satellites give way to the 1cm-per-pixel resolutions of real-time drone feeds and hungry laser-focused eyes of autonomous vehicles.
Contemporary neurobiology can shed light on this subject. How we conceive of space, increasingly appears to inform how memory and knowledge are structured in our brains. The rife spatial metaphors throughout language seem to stem from the map-like structures of memory.
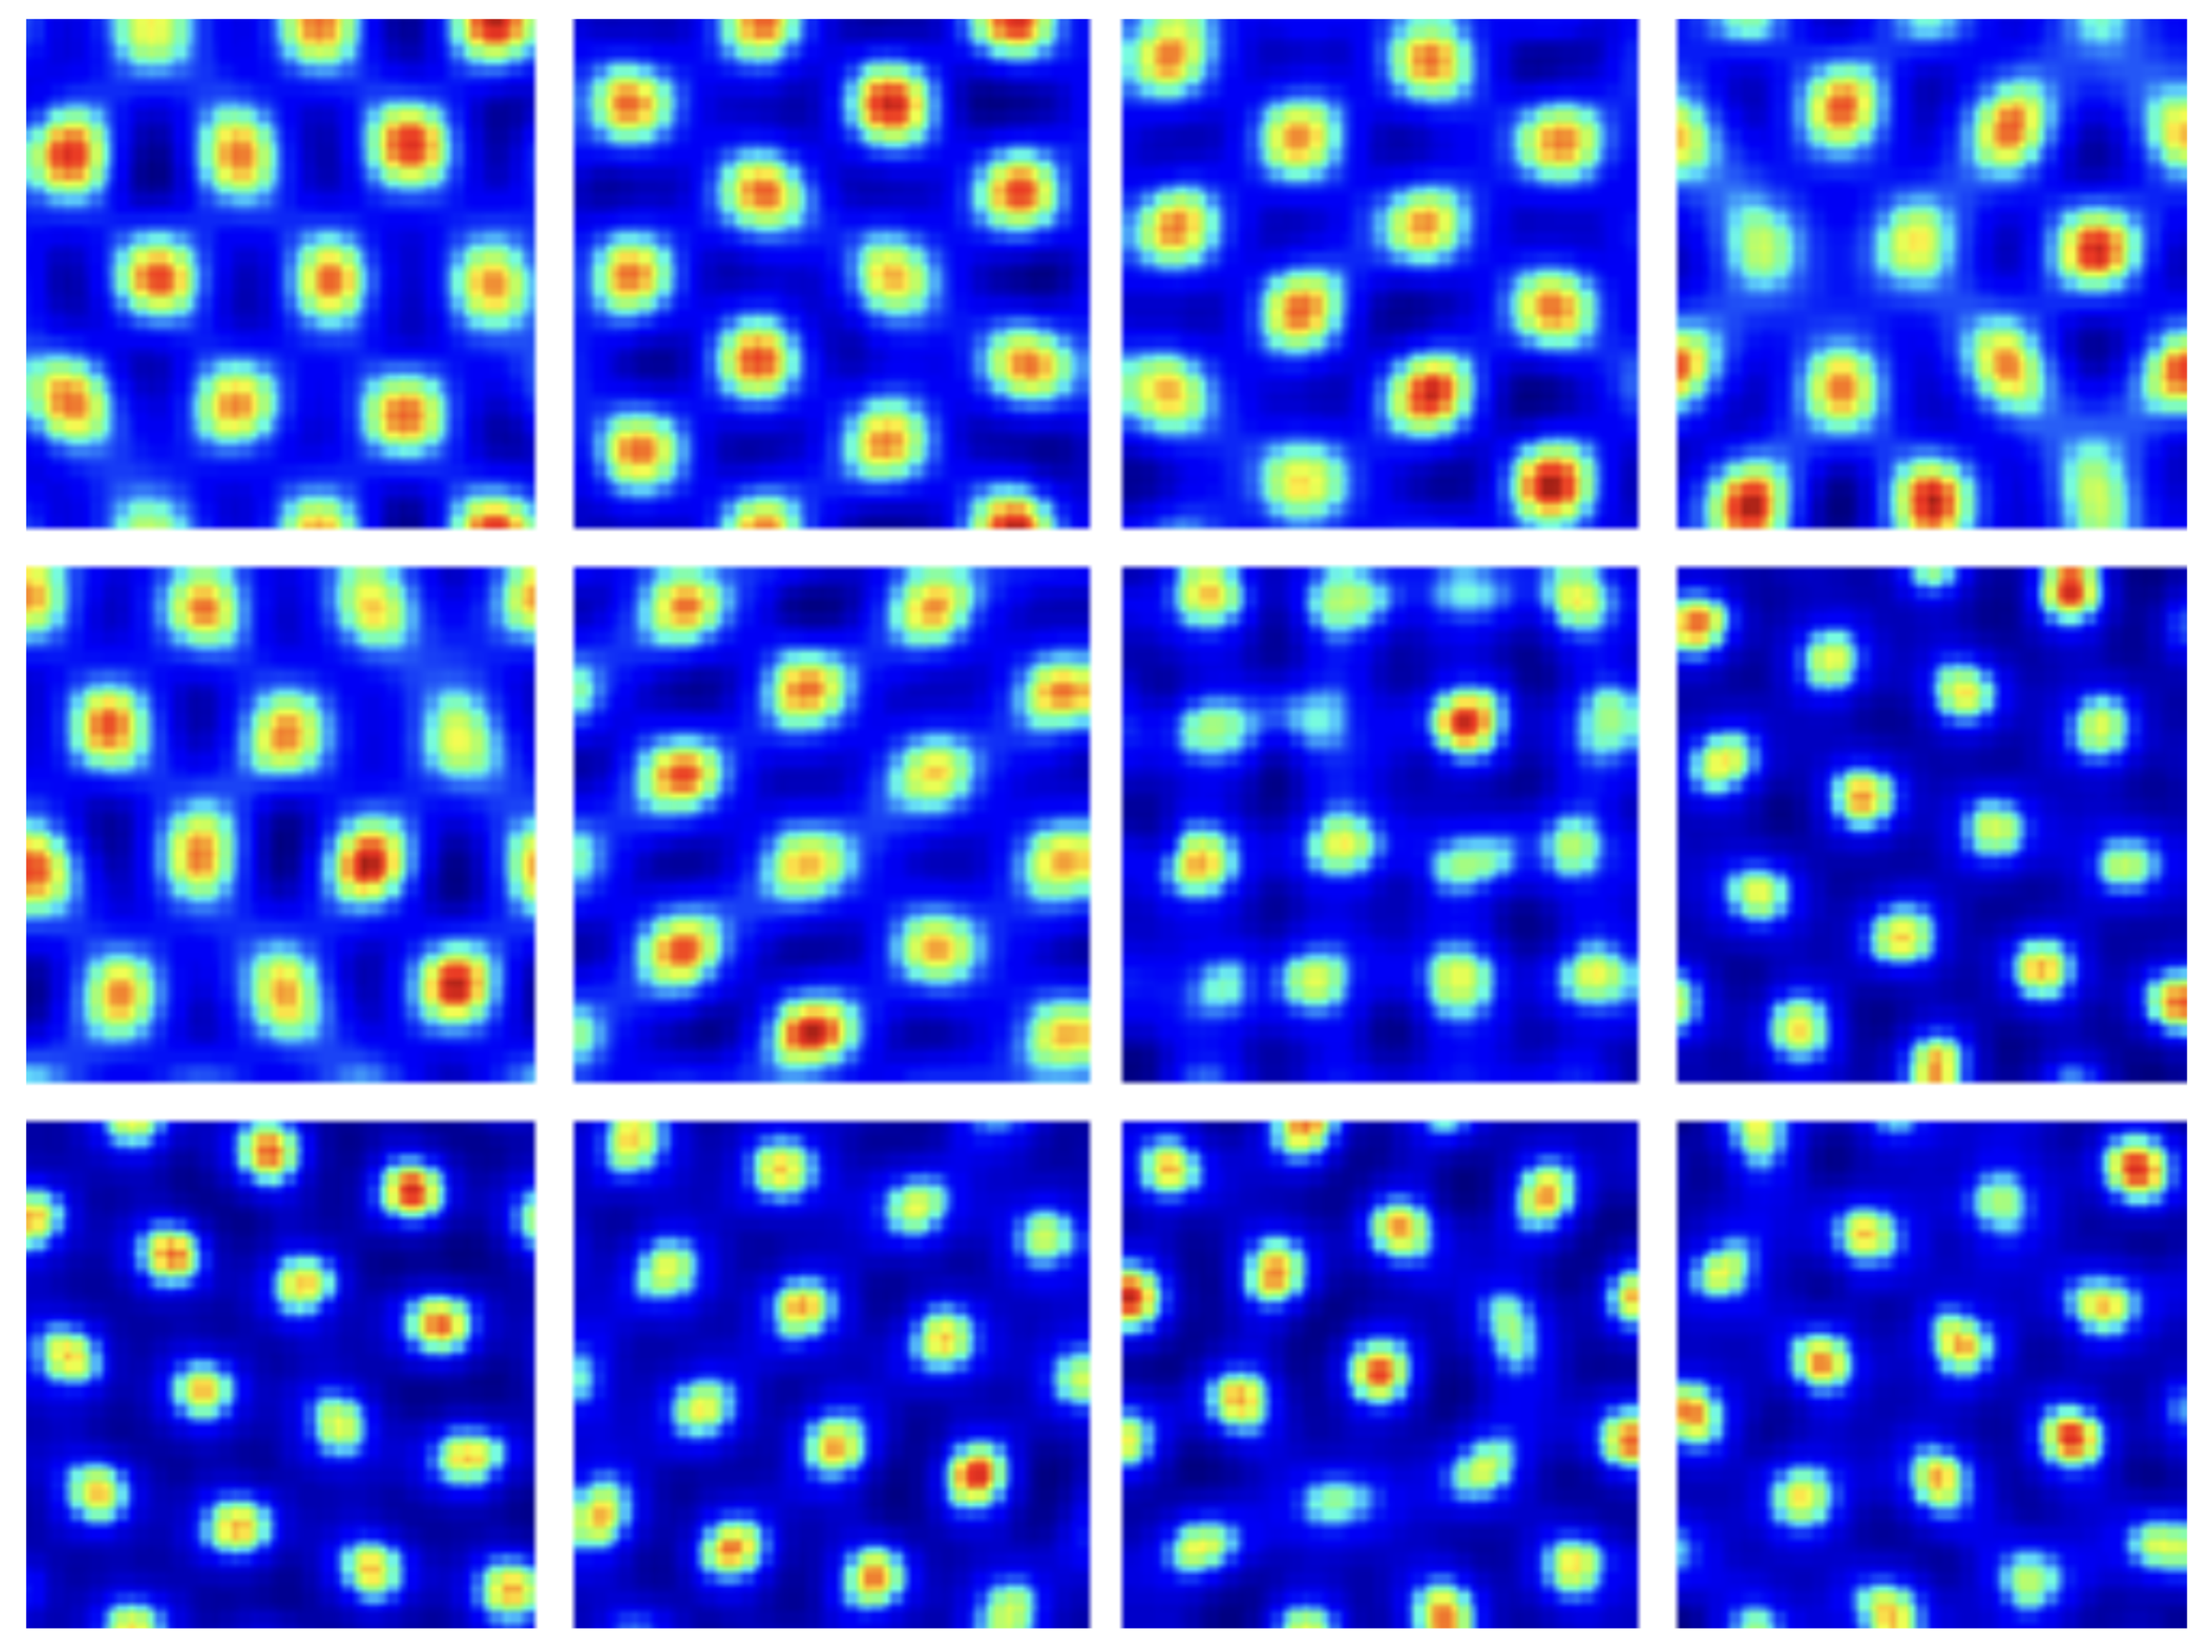
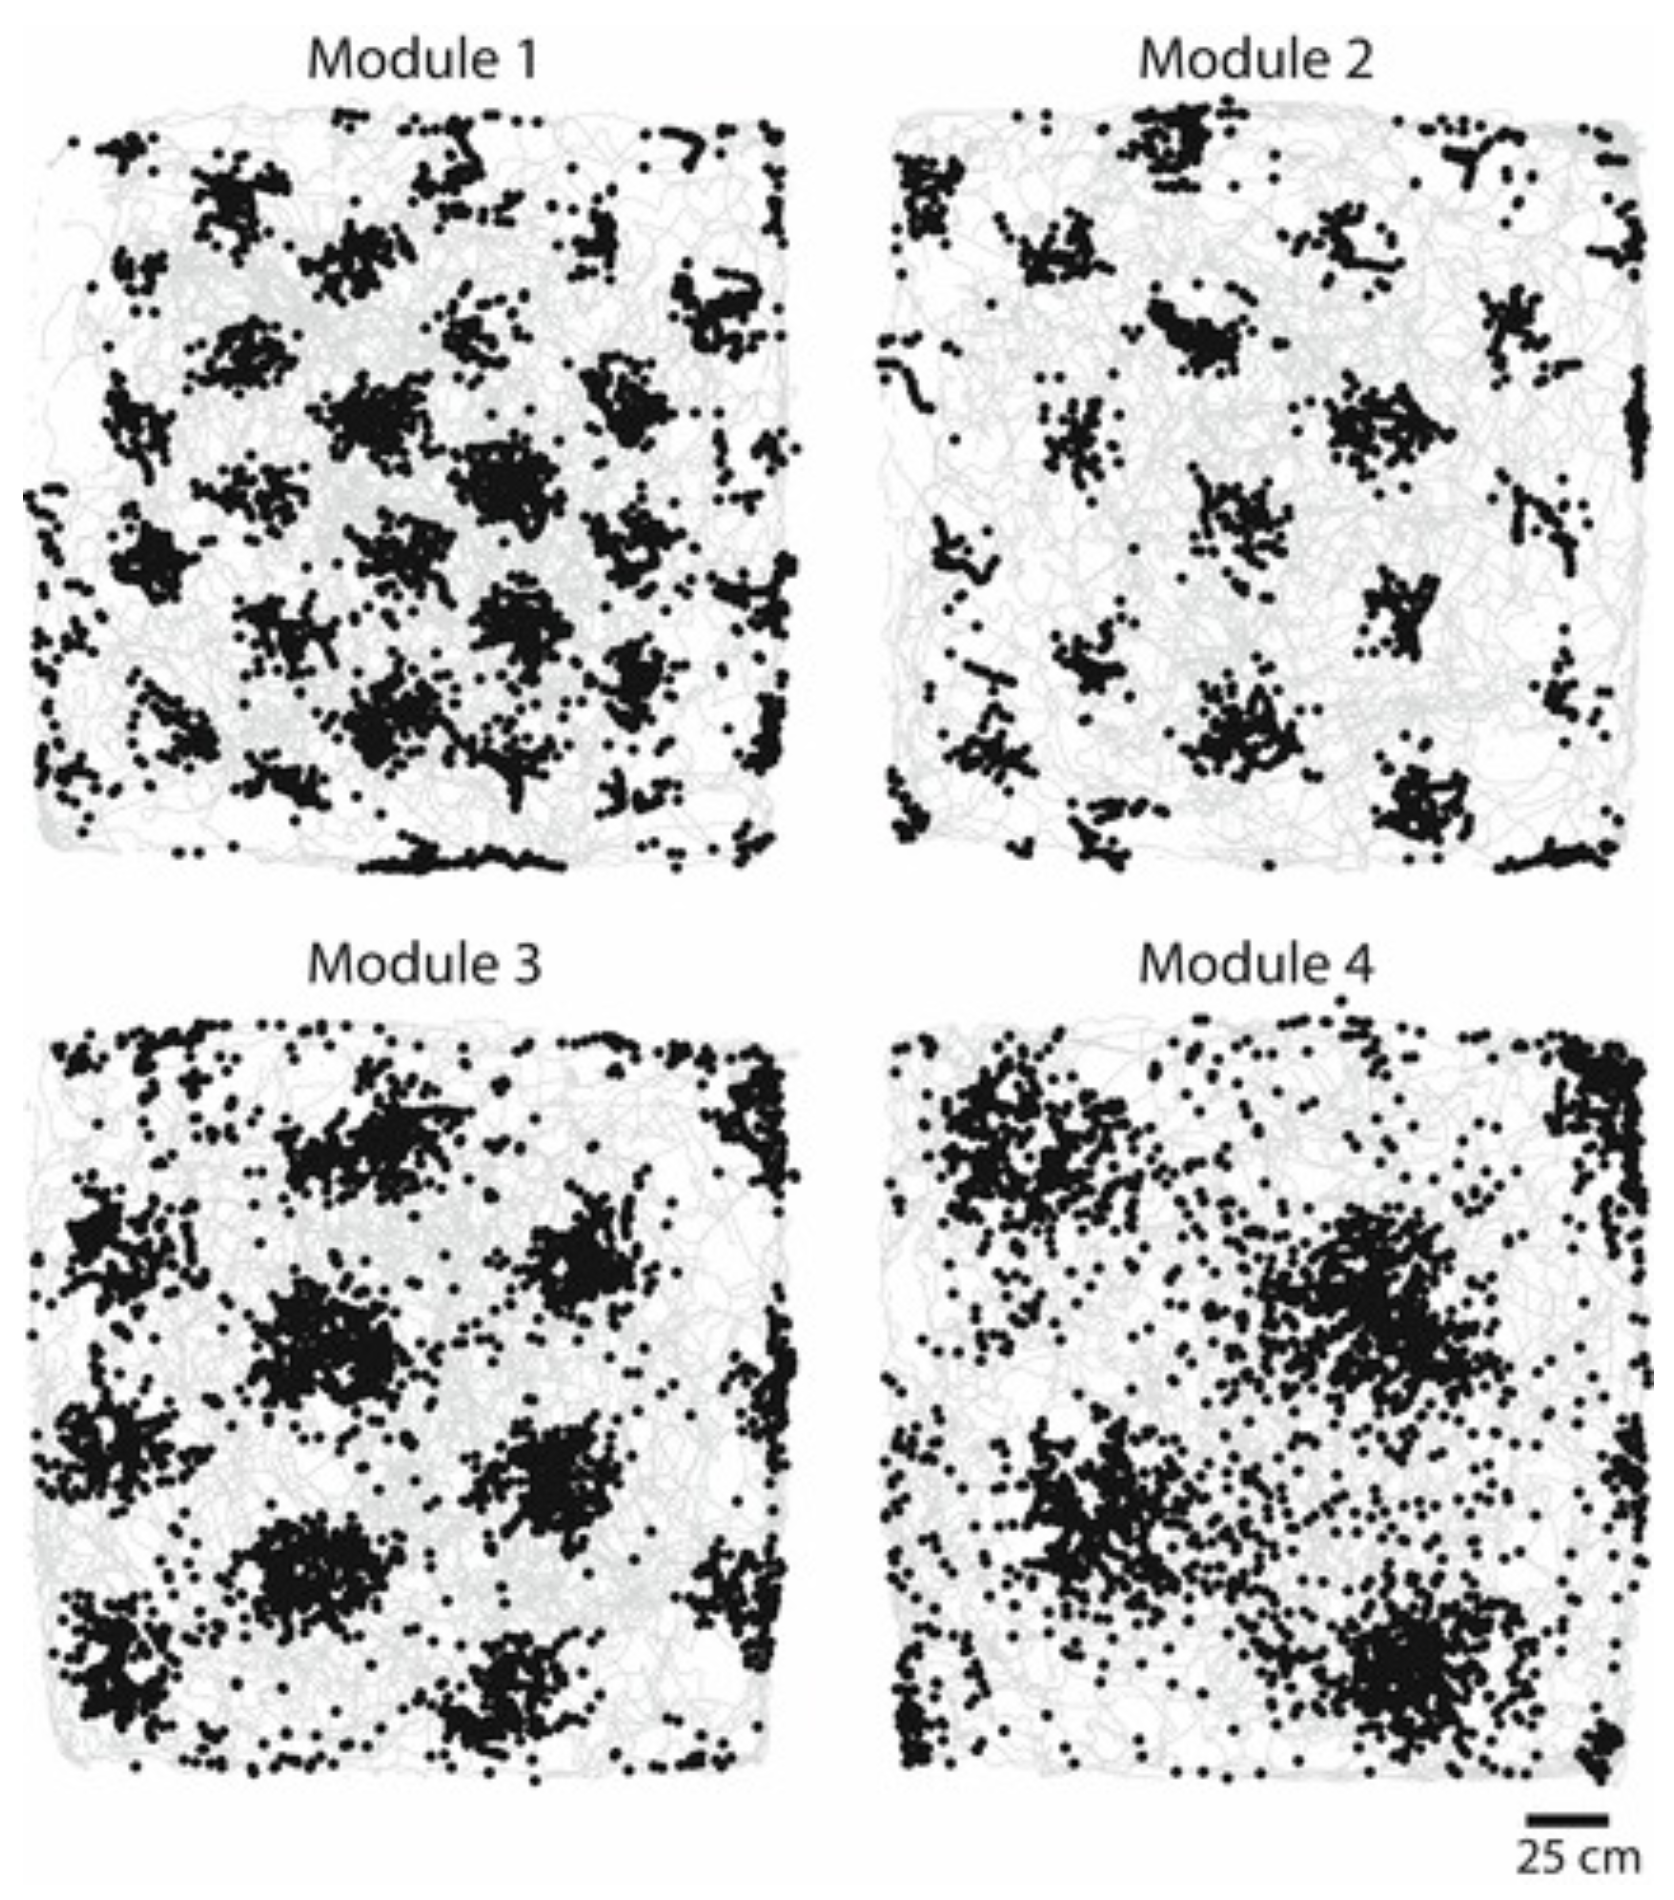
We can see this demonstrated in the physical neural mech- anisms at play in the most basic functions of perception such as neurons known as grid cells and place cells. These neurons, roughly speaking, allow us to orientate ourselves, and help us locate things respectively.7 A core difference between these two neural architectures is that place cells encode specific objects and landmarks in relation to each other, while grid cells operate as a hexagonal coordinate system. Here, in the most basic unit of our cognition, is the basis for the map and the plan.
Über Alles
One might assume that al-Khwārizmī was familiar with the politics that enabled his scholarly pursuits. His work was underwritten by the patronage of the caliph and the House of Wisdom. The work was at the core of a top-down cultural and political programme to absorb and develop the knowledge of the Hellenistic world initiated by the caliphs, the so-called ‘translation movement.’ The maps not only encode a worldview, but project an idea of worldly power. No matter how abstract the field one works in, it is inevitably tethered back to the social reality of a political context. Today the equivalent of al-Khwārizmī’s work is being carried out by the software engineers and data-wranglers of planetary-scale platforms such as Uber.
Alongside its core businesses, Uber has played a key role in the engineering of rapidly scalable data infrastructures. In the past few years, Uber has been broken and reformed by its own popularity. As user numbers exploded, the vast number of trips and locations flowing through the core technology meant that the infrastructure had to be rebuilt. The Uber app originally spawning from a single monolithic codebase was ‘rearchitected’ into a distributed system of robust ‘micro-services.’
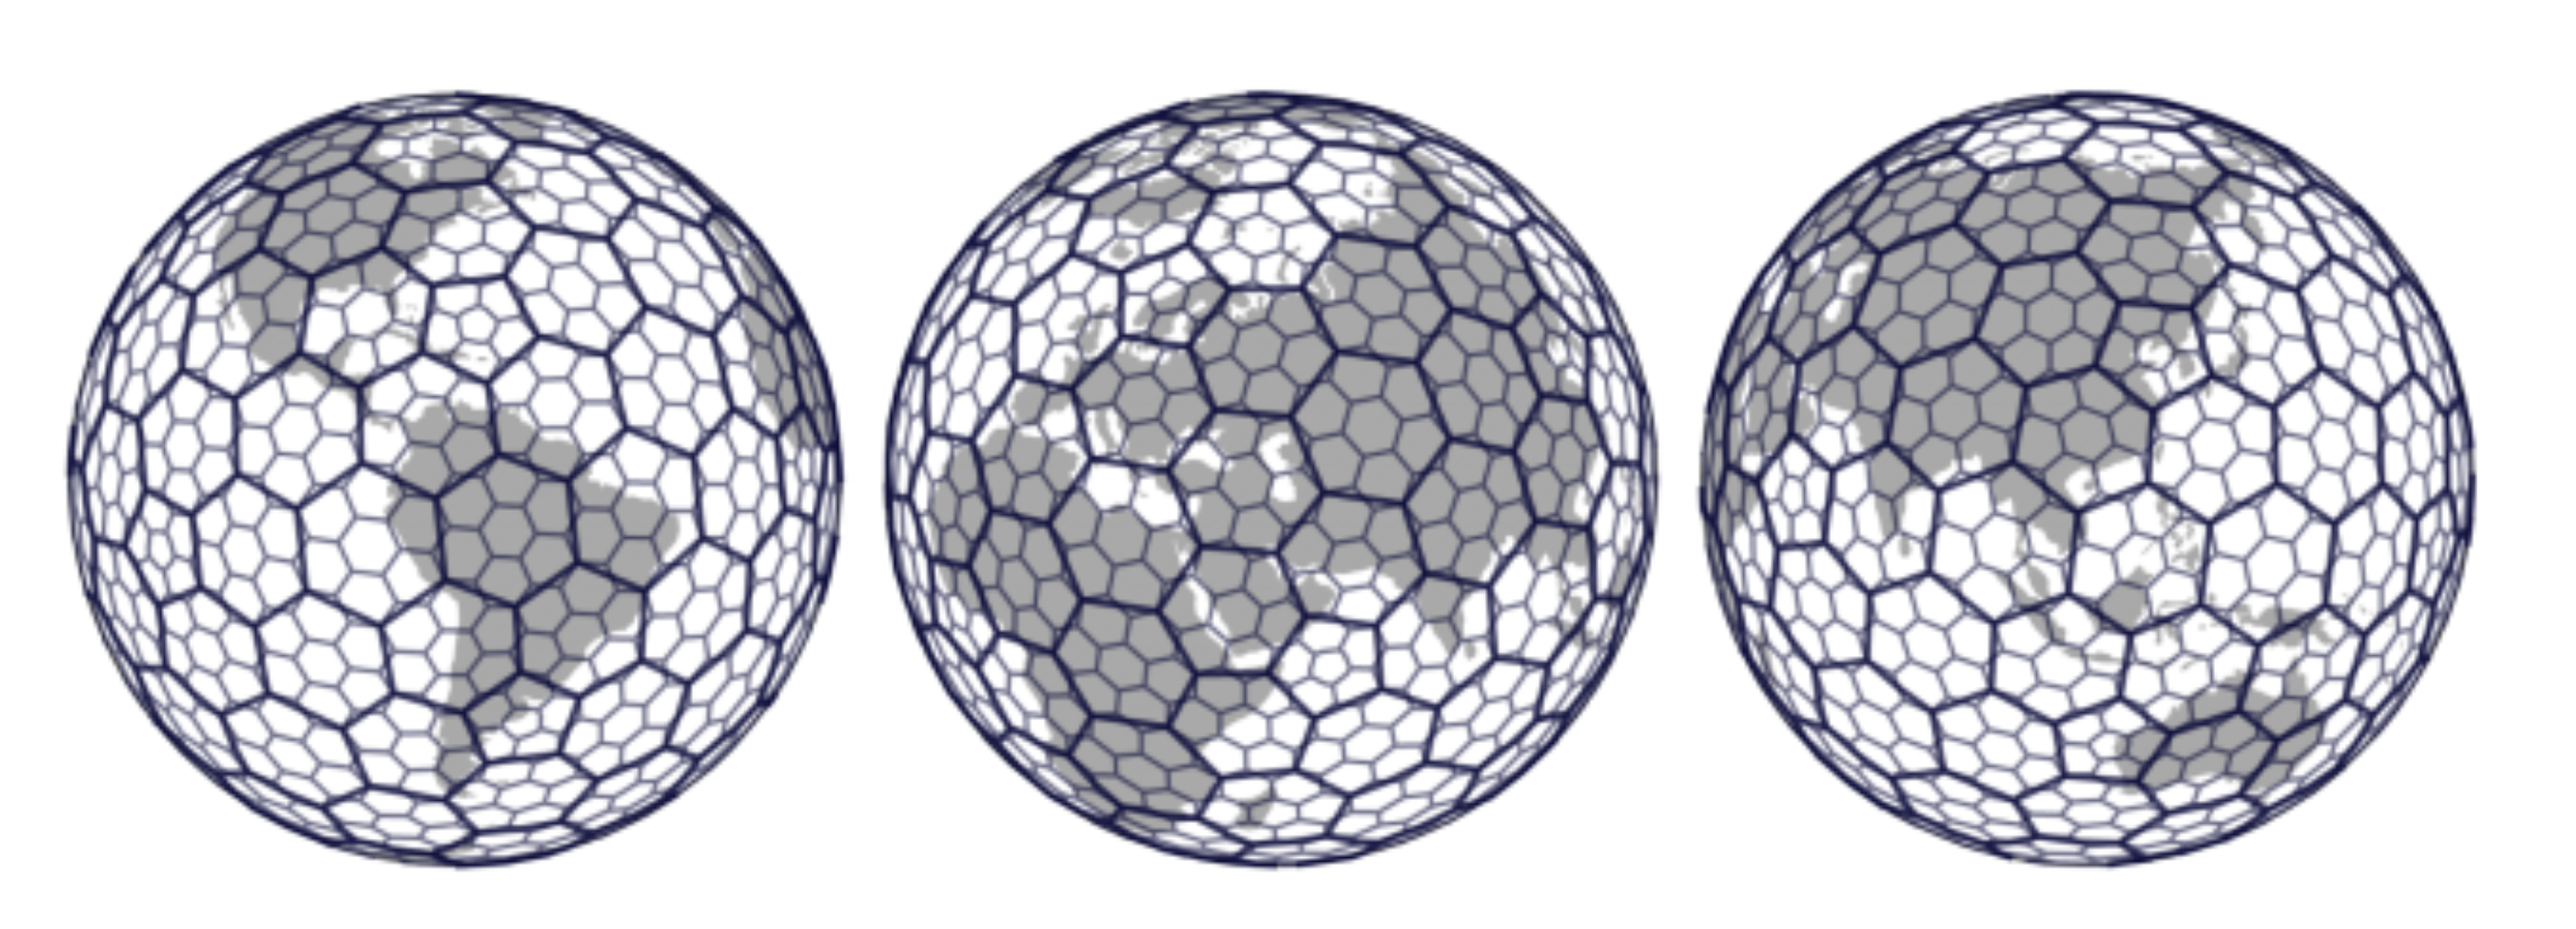
This was a daunting task given the scale of its operations, but one that has attracted many of the world’s most capable developers. One output has been H3,8 a new approach to global mapping utilising nested hexagons (and pentagons) to form a universal grid system that scales for the entire earth without the exaggerated extremes of other cartographic projections.
H3 is an example of a “discrete global grid system.”9 Such grids are generated by “recursive tessellation” so that each scale or resolution of the grid is formed of nested smaller versions of the same pattern, allowing for theoretically infinite scaling while using grid elements of different sizes within the same mapping. So, for instance, a large empty region can occupy far less of the memory over-heads compared to a dense city. Hexagons (rather than squares) allow for a much faster computational addressability by storing every location with a single 64-bit integer, as opposed to longer and more computationally costly latitude and longitude. These hexagons also help compensate for a problem within urban data visualisation at the scale of street networks. The problem lies in using a square grid to distribute data coordinates when overlaid with cities built according to particularly strong grids. This problem gets worse if the grids nearly align.
H3 anticipates a world where data production continues to explode, driven by an exponential growth in sensors and cameras required for automated vehicles. Crack open the boot of Uber’s last generation of experimental autonomous cars and you will find a colossal rig of CPUs, GPUs, and storage processing data points so numerous that wireless networks cannot currently provide the bandwidth to fully transmit them. This is the engine of the next cartography, underscored by machine intelligence.
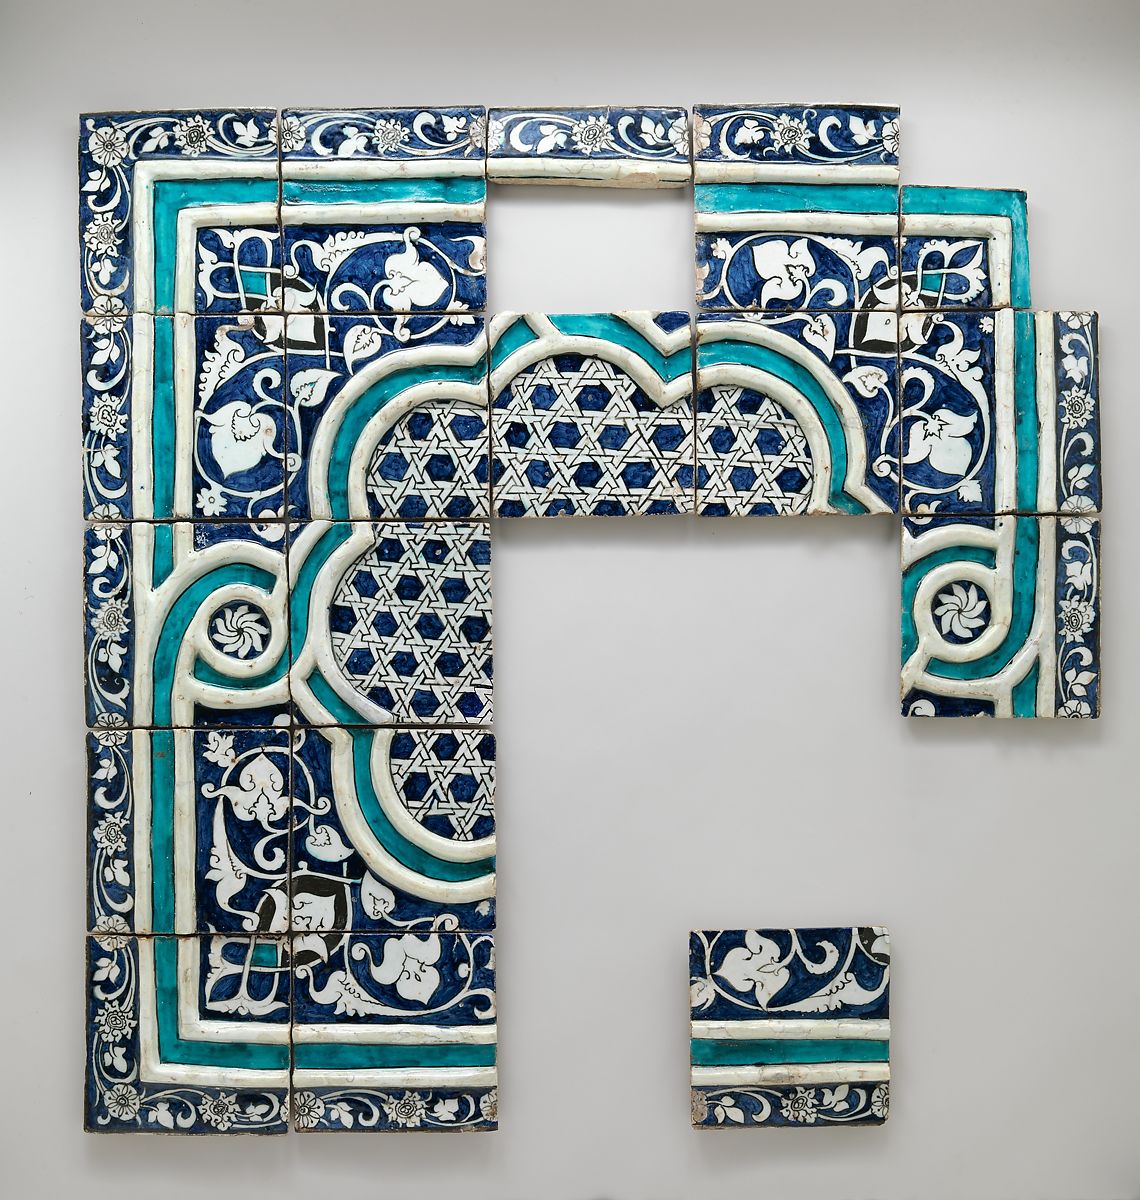
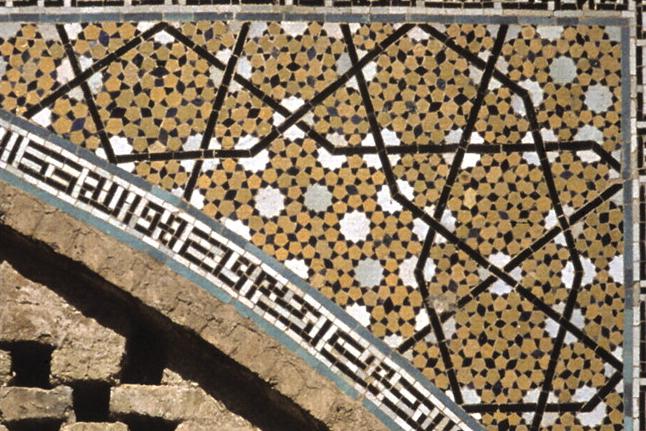
Uber’s mapping system — and even perhaps the images of our neural grid cells — are curiously reminiscent of the geometric patterns found within Islamic architecture. The earliest examples of this hexagon-based pattern first appeared towards the end of al-Khwārizmī’s life in 836 at the Great Mosque of Kairouan in Tunisia. It has been argued that the emergence of such patterns was influenced by the work of al-Khwārizmī and his contemporaries to reinterpret and expand upon the mathematics of Euclidean geometry,10 especially within the context of Islamic cosmology. As such we might see maps (and the way they are constructed) as artefacts that allow us to glimpse some of the most fundamental workings of our minds. Understood in this way, maps are part of a cyclical cultural production, where they are both the product and the manufacturer of minds.
Our worldview can appear so stable and consistent with the facts as we perceive them, that it sometimes appears to be as unimpeachable as revealed truth. But by scratching the surface, we find that the underpinning of any worldview is a construct. Through grids, co-ordinate systems, projections, or tabulated data, we make maps that order, distil, and re-present the world, in turn, altering our perceptions of it. We live in an era when the construction and configuration of such knowledge are undergoing a revolution as dramatic as the original contributions of al-Khwārizmī. We are already feeling the tremors of this reconfiguration. We should pay attention to the construction of this knowledge, because whoever makes the maps, ultimately makes us.
***
References
- Yossef Rapoport, Emilie Savage- Smith, An Eleventh-Century Egyptian Guide to the Universe, The Book of Curiosities, Brill, 2014
- Gerald J. Toomer, “Al-Khwarizmi” in Charles Coulston Gillispie (ed.), Dictionary of Scientific Biography, vol. 7, Gale Cengage, 1981
- Ahmad ibn Yahya ibn Fadlallāh Encyclopedia of the History of Arabic al-Umarī, “The Mamunic World Map.” Science, vol. 1, Routledge, 1996.
- Edward S. Kennedy, “Mathematical Geography,” in Roshdi Rashed (ed.),
- Cyrus Alai, “Mapping the Mediterranean: By the Cartographers of Medieval Islamic Societies” in Journal of the International Map Collectors’
- O.A.W. Dilke, “The Culmination of Greek Cartography in Ptolemy,” in J.B. Harley, David Woodward (eds.), The History of Cartography Volume 1: Press, 1987. Cartography in Prehistoric, Ancient, and Medieval Europe and the Mediterranean, The University of Chicago
- Jordana Cepelewicz, “The Brain Maps Out Ideas and Memories Like Spaces” in Quanta Magazine, January 14, 2019.
- Hexagonal Hierarchical Geospatial Indexing System 2018, h3geo.org
- OGC DGGS Standards Working Group www.ogc.org/projects/groups/dggsswg.
- Yahya Abdullahi, Mohamed pp. 243–251. Rashid Bin Embi, “Evolution of Islamic Geometric Patterns” in Frontiers of Architectural Research, 2013, vol. 2